View Helen’s LinkedIn Newsletter
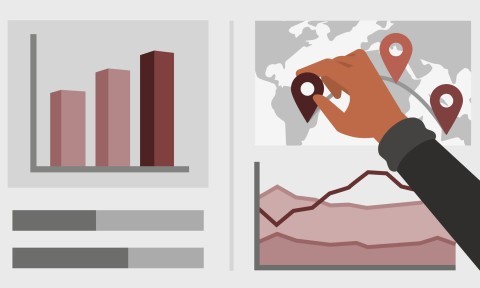
Power BI is a powerful data analytics application for modeling data and creating data visualizations. To truly leverage the power of Power BI, you need to use your visuals impactfully to communicate trends and analysis to make decisions. In this course, data analytics and business analysis expert Helen Wall focuses on the Power BI dashboard, where users interact with charts and graphs that communicate trends in their data. Go over building data dashboards, setting up the Power BI model and ecosystem, and choosing colors. Explore various tools to work with and data and visualize it. Learn ways to compare multiple values, and dive into the mapping options available to you. Find out how to customize tooltips, configure chiclet slicers, display Top N rankings, and more, to put it all together in your own dashboard. To wrap up, learn how to share your work with a phone view, publishing to the Power BI service, and sharing Power BI models.
Learn More